“The Dumbest Moment in the History of Television”? Not so fast

A segment about the 2020  presidential election primaries on MSNBC News on March 5 caused a flood of comments on Twitter. Here is the tweet that brought the segment into the Twittersphere and started all the ruckus: 

Both the guest, a member of the New York Times Editorial Board, and host Brian Williams failed to notice how absurd was the arithmetical claim being made. 

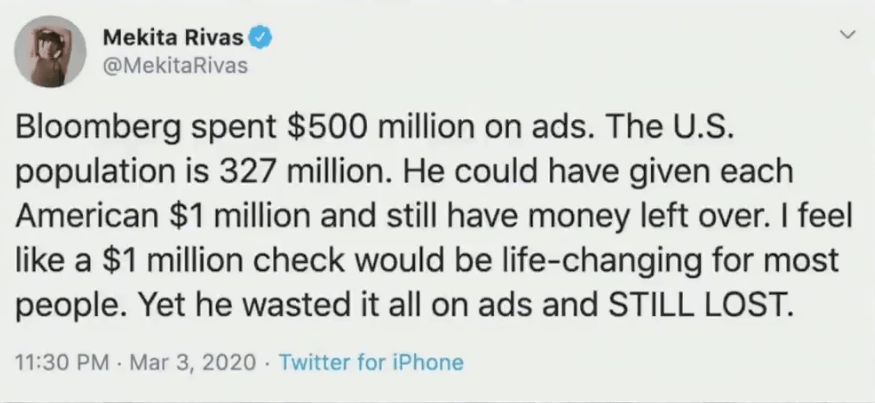
If this is the first time you have seen this segment, it likely flew by too quickly to register. Here (right) is the original tweet that started it all.

Curious as to who put out the tweet, I checked her profile. (See below.) [Normally I anonymize tweets, even though they are public, but on this case the tweet was shown on live national television.] She starts out with the claim that she is bad at math. I have no idea whether she is or she isn’t. But that tweet does not show she is. It actually suggests she may be a better mathematical thinker than many – read on.

Many of the comments on Twitter lamented the poor arithmetical skills of the tweeter and the two media figures on the show. In fact, the story went well beyond Twitter. The next day, the Washington Post, no less, devoted an entire article to the gaffe.

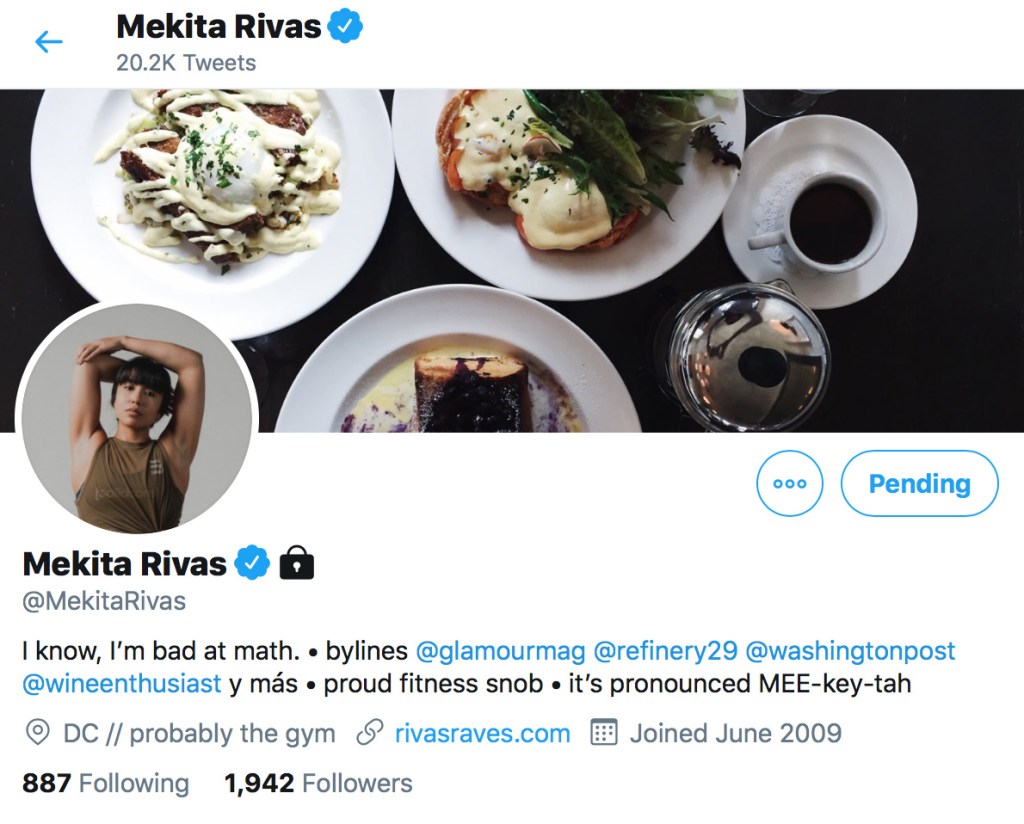
The Big Lead took another swipe the same day, pointing out that the tweeter, Mekita Rivas, is a freelance writer and Washington Post contributor, and noting that the math disclaimer on her Twitter bio was a result of her oh-so-public gaffe.

But she was by no means alone. The error was repeated, or at least overlooked, by a whole host of smart media folk: Mara Gay, the New York Times editorial board member who brought it up in her on-camera conversation, the MSNBC graphics department, several producers, host Brian Williams himself, and likely more.

The episode is reminiscent of the numerical error made by a famous New York Times commentator that I wrote about in a post a few days ago (March 3). To be sure, both episodes highlight the clear need, in today’s data saturated and data-driven world, for all citizens to have a reasonably well developed number sense.

For this problem is not, as many critics of Ms Rivas claimed, that she cannot do basic arithmetic. I would not be surprised  if she were no worse than most other people, and besides arithmetic skill became in-principle obsolete with the introduction of the electronic calculator in the 1960s, and in every practical sense became really obsolete when we entered an era where we all carry around an arithmetic powerhouse in our smartphone. [There is educational value from teaching basic arithmetic, but that is a separate issue.]

What is most definitely not obsolete, however, and is in fact, a crucial human skill in today’s world, is number sense. What was worrying about the whole Twitter–MSNBC episode is that none of those involved recognized instinctively that the claim in the original tweet was absurd.

The two follow-up news articles I just referred to delve into the absurdity of the error, which comes down to the difference between $1M+ and $1.52.

But this is where it gets interesting. What is it about the statement in the Rivas tweet that led a whole host of smart professionals to not see the error? What led them to not feel in their bones that the amount every American actually would receive from Bloomberg would be “something a bit north of a dollar-fifty” and not a sum “in excess of a million dollars.” This is not a question of calculating; it’s not poor arithmetic. It’s something else, and it’s far more dangerous. Doing arithmetic is something our iPhone can do, quickly, error-free, and with more numbers, and bigger numbers, than we computationally-puny humans can comfortably handle. Understanding numbers, on the other hand, is very much people stuff. Our devices understand nothing.

If a whole group of smart people are so quantitatively illiterate (and that’s what we are talking about) that they don’t instinctively see the Rivas error , how can we as a society make life-critical decisions such as assessing our personal risk in the coronavirus outbreak or the degree to which we should take a candidate’s climate change policies into consideration when deciding who to vote for.

This is why I, and many others in mathematics education, are putting such stress on the acquisition of number sense. Indeed, an article I wrote for the Huffington Post on January 1, 2017 carried the headline Number Sense: the most important mathematical concept in 21st Century K-12 education. I was not exaggerating.

Many of the videos and blogposts on (and referred to on) this website focus on number sense, and discuss how best to ensure no future citizen graduates from high school without adequate number sense. (The Common Core State Standards are designed to achieve that goal, though teaching practices often seem to miss that point, sometimes as a result of inappropriate administrative pressure coming from poorly informed politicians.)

What interested me in particular about the MSNBC example was the nature of the error. It’s similar to the example I discuss at the end of the first of the Blue Notebook videos on this site, in that the way the proposition is worded triggers learned arithmetic skills (more accurately, and appropriately derisive, “test-taking tricks”) that in general are reliable.

Here is the Rivas argument, spelled out:

1. FACT : Bloomberg spent $500 million on TV ads.

2. FACT: The US population is 327 million.

3. (FALSE) ARGUMENT: We are talking millions here. If you take the whole amount and divide it up among the population, everyone gets 500 divided by 327 (millions). Good heavens, that’s more than one million each!

Rivas is doing two smart things here – smart in the sense that, in general, they lead to the correct answer quickly with the least effort, which is what she (and you) likely needed to be able to do to pass timed math tests.

1. First, she says, everything is about millions, so we can forget those six zeros at the end of each number. [GOOD MOVE]

2. Then she says, we have to divide to see how much each person would get. That’s 500 divided by 327, which is around 1.5 (or at least more than 1). [GOOD MOVE]

3. Then finally she remembers everything is in millions. So it’s really $1.5M (or more than $1M). [EXCELLENT. SHE REMEMBERED THE SIMPLIFICATION AND PUT THE ZEROES BACK IN]

On its own, the idea behind each step is fine, indeed can be useful – in the right circumstances. But not, unfortunately, in this coupling! [I’m not saying she went through these steps consciously doing each one. Rather, she was surely applying a heuristic she had acquired with practice in order to pass math in school.]

The trouble is, if someone leaves school having mastered a bunch of heuristics to pass timed math tests – which is how many students get through math – but has not been taught how to think intelligently about numbers (and thereby develop number sense), then they are prone to be tripped up in this way.

Not convinced? Check out the example toward the end of that first Blue Notepad video. It’s a bit more subtle than the MSNBC example I am discussing here; in fact, more than half the people in every audience I have given that example to (under time pressure) get it wrong. The odds are, you would have too. But the overall message about math education is the same.

Ms. Rivas should take that disclaimer off her Twitter bio.

But maybe replace it by one that says, “I need to improve my number sense.” That’s a motto that – by my observation of the news media, social media, and society in general – would well serve the majority of people, including many who are good at “getting the right answer.”

The crucial importance of digital literacy in 21st Century math education

A common theme among the articles and videos on this website is the regular use of online resources in developing and using mathematics. The image shown here (which you will find in several of my videos and linked-articles on the site) presents some of the digital tools professional mathematicians use most commonly when working on a problem.

This particular list is based on my own experience over several decades working on problems for industry and various branches of the US government, and in conducting various academic research projects, but also includes two tools (MATLAB and the graphing calculator) that I do not use but many other mathematicians do, which I list as a nod towards others’ toolboxes. I typically use those tools in the order they appear in the display, reading left-to-right.

Whenever I show this image to an audience, I inevitably remark that the use of, in particular, Google and Youtube requires a degree of sophistication in order to (1) find the most useful sites and (2) assess the reliability of the information provided on those sites. Item (1) requires sufficient knowledge to enter keywords and phrases that pull up useful resources; item (2) depends on a skillset generally referred to as digital literacy.

Given the central role of digital tools and online resources in contemporary mathematical praxis, these two skillsets are absolutely critical components in 21st Century mathematical praxis. That means they have to be part of all students’ mathematics education.

The first skillset, being able to make effective use of search engines to navigate to relevant information and online resources, has to be provided in the mathematics class. It is only by having a good, broad overview of a sufficiently large part of the range of mathematical concepts, facts, methods, procedures, and tools that are available, that a student can select keywords and phrases to conduct a productive search. Such an overview can be acquired only by experience, over several years.

Since there is no longer any need for a student to spend many hours practicing the hand execution of mechanical procedures for solving math problems in order to achieve accuracy and speed, the vast amounts of time freed up from what used to be a massive time sink, can be devoted to working on a wide variety of different kinds of problem.

[CAVEAT: Whether an individual teacher has the freedom to follow this strategy is another matter. Sensible implementation of mathematics education along the lines of the Common Core should, in theory, make this possible; indeed, the CCSSM were developed — as standards, not a curriculum — to facilitate this. But I frequently see complaints that various curricula and local school districts still insist on a lot of rote practice of skills that will never be used. Other than use my bully pulpit to try to change that, as I not infrequently do, I cannot remove that obstacle, I’m afraid.]

Turning to the second skillset, assessing the reliability of the information provided on a Web resource, in today’s world that needs to be a major component of almost every classroom subject. 

In the case of Wikipedia, which is high on my list of mathematical tools, for post-secondary mathematics it is an efficient and highly reliable resource to find out about any particular mathematical definition, concept, or technique — its reliability being a consequence of the fact that only knowledgeable professional mathematicians are able to contribute at that level. Unfortunately, the same cannot be said for K-12 mathematics. 

For example, a quick look as I was writing this post showed that the Wikipedia entry for multiplication is highly misleading. In fact, it used to be plain wrong until I wrote a series of articles for the Mathematical Association of America a few years ago. [See the section on Multiplication in this compilation post.] However, while the current entry is not exactly wrong, its misleading nature is a pedagogic disaster in the making. It therefore provides a good example of why the wise teacher or student should use Wikipedia with extreme caution as a resource for K-12 mathematics.

Ditto for Google, Youtube, and any other online resource. “Buyer beware” needs to be the guiding principle.

Unfortunately, a recent report from Stanford’s Graduate School of Education (see momentarily) indicates that for the most part, America’s school system is doing a terrible job in making sure students acquire the digital literacy skills that are of such critical importance to everyone in today’s world.

Note: I am not pointing a finger at any one person or any one group here. It is the education system that’s failing our students. And not just at K-12 level. Higher education too needs to do a lot more to ensure all students acquire the digital literacy that is now an essential life skill.

The Stanford report focuses on Civics, a domain where the very functioning of democracy and government requires high levels of digital literacy, as highlighted by the massive growth of “fake news” in the period leading up to the 2016 U.S. election, and subsequently. But the basic principles of digital literacy apply equally to mathematics and pretty well any discipline where online resources are used (which is pretty well any discipline, of course). So the Stanford report provides an excellent pointer to what needs to be done in all school subjects, including mathematics.

The report is readily available online: Students’ Civic Online Reasoning, by Joel Breakstone, Mark Smith, & Sam Wineburg, The Stanford History Education Group, 14 November, 2019. (Accessing it provides an easy first exercise in applying the reliability assessing skills the report points to!)

While I recommend you read the whole thing (there is a PDF download option), it is 49 pages in length (including many charts), so let me provide here a brief summary of the parts particularly pertinent to the use of online resources in mathematics.

First, a bit of general background to the new report. In November 2016, the Stanford History Education Group released a study showing that young people lacked basic skills of digital evaluation. In the years since then, a whole host of efforts—including legislative initiatives in 18 states—have tried to address this problem. Between June 2018 and May 2019, the Stanford team conducted a new, deeper assessment on a national sample of 3,446 students, chosen to match the demographic profile of high school students across the United States.

The six exercises in the assessment gauged students’ ability to evaluate digital sources on the open internet. The results should be a wake-up call for the nation. The researchers summed up the results they found in a single, dramatic sentence: “The results—if they can be summarized in a word—are troubling.”

The nation’s high school students are, it seems, hopelessly ill-equipped to use the Internet as a source for information. The report cites the following examples:

• Fifty-two percent of students believed a grainy video claiming to show ballot stuffing in the 2016 Democratic primaries (the video was actually shot in Russia) constituted “strong evidence” of voter fraud in the U.S. Among more than 3,000 responses, only three students tracked down the source of the video, even though a quick search turns up a variety of articles exposing the ruse.

• Two-thirds of students couldn’t tell the difference between news stories and ads (set off by the words “Sponsored Content”) on Slate’s homepage.

• Ninety-six percent of students did not consider why ties between a climate change website and the fossil fuel industry might lessen that website’s credibility. Instead of investigating who was behind the site, students focused on superficial markers of credibility: the site’s aesthetics, its top-level domain, or how it portrayed itself on the About page.

The assessment questions used by the Stanford team were developed after first looking at the ways three groups of Internet users evaluated a series of unfamiliar websites: Stanford freshmen, university professors from four different institutions, and fact checkers from some of the country’s leading news outlets.

Of particular relevance, the fact checkers’ approach differed markedly from the undergraduates and the professors.

When fact checkers landed on an unknown website, they immediately left it, and opened new browser tabs to search for information about the trustworthiness of the original source. (The researchers refer to this approach as lateral reading.)

In contrast, both the students and the academics typically read vertically, spending minutes examining the original site’s prose, references, About page, and top-level domain (e.g., .com versus .org). Yet these features are all easy to manipulate. 

Fact checkers’ first action upon landing on an unfamiliar site is, then, to leave it. The result of this seemingly paradoxical behavior is that they read less, learn more, and reach better conclusions in less time. Their initial goal is to answer three questions about the resource: (1) Who is behind the information? (2) What is the evidence? (3) What do other sources say? 

While the value of the fact-checkers’ approach is critical in navigating today’s online sources of news and current affairs, the approach is no less critical in using online resources in the STEM disciplines.

For instance, imagine the initial stage of collecting data for a mathematical analysis of problems about climate change, the effectiveness of vaccines, or diet — all topics that students find highly engaging, and which thus provide excellent projects to learn about a wide variety of mathematical techniques. In all three cases, there is no shortage of deliberate misinformation that must be filtered out. 

Here then, is a summary of the six assessment tasks the Stanford team developed, listed with the fact-checkers initial questions being addressed in each case, together with (in italics) the specific example task given to the students:

  • Evaluating Video Evidence (What’s the evidence? Who’s behind the information? Evaluate whether a video posted on Facebook is good evidence of voter fraud.)
  • Webpage Comparison (Who’s behind the information? Explain which of two websites is a better source of information on gun control.) 
  • Article Evaluation (What do other sources say? Who’s behind the information? Using any online sources, explain whether a website is a reliable source of information about global warming.)
  • Claims on Social Media 1 (What’s the evidence? Who’s behind the information? Explain why a social media post is a useful source of information about background checks for firearms.)
  • Claims on Social Media 2 (What’s the evidence? Who’s behind the information? Explain how a social media post about background checks might not be a useful source of information.)
  • Homepage Analysis (Who’s behind the information? Explain whether tiles on the homepage of a website are advertisements or news stories.)

The remainder of this post focuses on the study’s results of particular relevance to mathematics education. It is taken, with minimal editing, directly from the original report.

Overall, the students in the high schools study struggled on all of the tasks. At least two-thirds of student responses were at the â€œBeginning” level for each of the six tasks. On four of the six tasks, over 90% of students received no credit at all. Out of all of the student responses to the six tasks, fewer than 3% earned full credit.

Claims on Social Media question 1 had the lowest proportion of Mastery responses, with fewer than 1% of students demonstrating a strong understanding of the COR competencies measured by the task.

Evaluating Evidence had the highest proportion, with 8.7% earning full credit. 

The Website Evaluation task (which is of particular significance for the use of online resources in mathematics) had the highest proportion of “Beginning” scores, with 96.8% of students earning no points. The question assessed whether students could engage in lateral reading—that is, leaving a site to investigate whether it is a trustworthy source of information. Students were provided a link to the homepage of CO2 Science (co2science.org), an organization whose About page states that their mission is to “disseminate factual reports and sound commentary” on the effects of carbon dioxide on the environment. Students were asked whether this page is a reliable source of information. Screen prompts reminded students that they were allowed to search online to answer the question. The few students who earned a Mastery score used the open internet to discover that CO2 Science is run by the Center for the Study of Carbon Dioxide and Global Change, a climate change denial organization funded by fossil fuel companies, including ExxonMobil. The Center for the Study of Carbon Dioxide and Global Change also has strong ties to the American Legislative Exchange Council, an organization that opposes legislative efforts to limit fossil fuel use.

A student from a rural district in Oregon wrote: “I do not believe this is a reliable source of information about global warming because even though the company is a nonprofit organization, it receives much of its funding from the “largest U.S. oil company–ExxonMobil–and the largest U.S. coal mining company–Peabody Energy” (Greenpeace). Moreover, Craig Idso, the founding chairman of the Center for the Study of Carbon Dioxide and Global Change, was also a consultant for Peabody Energy. It is no wonder this organization advocates for unrestricted carbon dioxide levels; these claims are in the best interest of the Center for the Study of Carbon Dioxide and Global Change as well as the oil and mining companies that sponsor it.”

Another student from suburban Oklahoma responded: “No, it is not a reliable source because it has ties to large companies that want to purposefully mislead people when it comes to climate change. According to USA TODAY, Exxon has sponsored this nonprofit to pump out misleading information on climate change. According to the Seattle Post-Intelligencer, many of their scientists also have ties with energy lobbyists.”

Both students adeptly searched for information on the internet about who was behind the site. Both concluded that the site was unreliable because of its ties to fossil fuel interests.

Unfortunately, responses like these were exceedingly rare. Fewer than two percent of students received a “Mastery” score. Over 96% of student responses were categorized as “Beginning”. Instead of leaving the site, these students were drawn to features of the site itself, such as its top-level domain (.org), the recency of its updates, the presence or absence of ads, and the quantity of information it included (e.g., graphs and infographics). 

A student from suburban New Jersey wrote: “This page is a reliable source to obtain information from. You see in the URL that it ends in .org as opposed to .com.” This student was seemingly unaware that .org is an “open” domain; any individual or group can register a .org domain without attesting to their motives. A student from the urban South was taken in by CO2 Science’s About page: “The ‘about us’ tab does show that the organization is a non-profit dedicated to simply providing the research and stating what it may represent. In their position paper on CO2, they provide evidence for both sides and state matters in a scientific manner. Therefore, I would say they are an unbiased and reliable source.”As the Stanford team note in their report, “Accepting at face value how an unknown group describes itself is a dangerous way to make judgments online.”

In fact, students often displayed a confusion about the meaning of top-level domains such as .org. While there are many .org’s that work for social betterment, the domain is a favorite for political lobby groups and groups that cast themselves as grassroots efforts but which are actually backed by powerful political or commercial interests). For-profit companies can also be listed as .org’s. Craigslist, a corporation with an estimated $1 billion in revenue in 2018, is registered as craigslist.org. Nor is nonprofit status a dependable marker of an organization’s credibility. Obtaining recognition by the IRS as a public charity is an extremely easy thing to do. Of the 101,962 applications the IRS received in 2015, 95,372 were granted tax-deductible status—an approval rate of 94%.

Food for thought, don’t you agree?

For a discussion of the other items in the study, I’ll refer you to the report itself. 

Let me end by re-iterating that the specific findings I listed above are all highly relevant to developing good skillsets for using online resources in mathematics. 

Why straight A’s may indicate poor learning – report from an unusual study

This post is the promised sequel to its predecessor, On making omelets and learning math.

So you got an A. What does that say about how well you are able to apply your new-found knowledge a month from now?

There’s plenty of research into learning (from psychology, cognitive science, neuroscience, and other disciplines) that explains why learning mathematics (more precisely, learning it well, so you can use it later on) is intrinsically difficult and frustrating. But for non-scientists in particular, no amount of theoretical discussion will have quite the impact as the hard evidence from a big study, particularly one run the same way pharmaceutical companies test the effectiveness (and safety) of a new drug.

Unfortunately, studies of that nature are hard to come by in education—for the simple reason that, unlike pharmaceutical research, they are all but impossible to run in the field of learning.

But there is one such study. It was conducted a few years ago, not in K-12 schools, but at a rather unique, four-year college. That means you have to be cautious when it comes to drawing conclusions about K-12 learning. So bring your own caution. My guess is that, like me, when you read about the study and the results it produced, you will conclude they do apply to at least Grades 8-12. (I can’t say more than that because I have no experience with K-8, either first-hand or second.)

The benefits of conducting the study at this particular institution was that is allowed the researchers to conduct a randomized control study on a group of over 12,000 students over a continuous nine-year period starting with their first four years in the college. That’s very much like the large scale, multi-year studies that pharmaceutical companies run (indeed, are mandated to run) to determine the efficacy and safety of a new drug. It’s impossible to conduct such a study in most K-16 educational institutions—for a whole variety of reasons.

Classroom at the United States Air Force Academy in Colorado Springs, Colorado

For the record, I’ll tell you the name of that particular college at the outset. It’s the United States Air Force Academy (USAFA) in Colorado Springs, Colorado. Later in this article, I’ll give you a full overview of USAFA. As you will learn, in almost all respects, its academic profile is indistinguishable from most US four-year colleges. The three main differences—all of which are important for running a massive study of the kind I am talking about—are that (1) the curriculum is standard across all instructors and classes, (2) grading is standardized across all classes, and (3) students have to serve five years in the Air Force after graduation, during which time they are subject to further standardized monitoring and assessment. This framework provided the researchers a substantial amount of reliable data to measure how effective were the four years of classes as preparation for the graduates first five years in their chosen specialization within the Air Force.

True, the students at USAFA are atypical in wanting a career in the military (though for some it is simply a way to secure a good education “at no financial cost”, and after their five years of service are up they leave and pursue a different career). In particular, they enter having decided what they want to do for the next nine years of their lives. That definitely needs to be taken into account when we interpret the results of the study in terms of other educational environments. I’ll discuss that in due course. As I said, bring your own caution. But do look at—and reflect on—the facts before jumping to any conclusion

If that last (repeated) warning did not get your attention, the main research finding from the study surely will: Students who perform badly on course assignments and end-of-course evaluations turn out to have learned much better than students who sail through the course with straight A’s.

There is, as you might expect, a caveat. But only one. This is an “all else being equal” result. But it is a significant finding, from which all of us in the math instruction business can learn a lot.

As I noted already, conducting a study that can produce such an (initially surprising) result with any reliability is a difficult task. In fact, in a normal undergraduate institution, it’s impossible on several counts!

First obstacle: To see how effective a particular course has been, you need to see how well a student performs when they later face challenges for which the course experience is—or at least, should be—relevant. That’s so obvious, in theory it should not need to be stated. K-16 education is meant to prepare students for the rest of their lives, both professional and personal. How well they do on a test just after the course ends would be significant only if it correlated positively with how well they do later when faced with having to utilize what the course purportedly taught them. But, as the study shows, that is not the case; indeed the correlation is negative. 

The trouble is, for the most part, those of us in the education system usually have no way of being able to measure that later outcome. At most we can evaluate performance only until the student leaves the institution where we teach them. But even that is hard. So hard, that measuring learning from a course after the course has ended and the final exam has been graded is rarely attempted.

Certainly, at most schools, colleges, or universities, it’s just not remotely possible to set up a pharmaceutical-research-like, randomized, controlled study that follows classes of students for several years, all the time evaluating them in a standardized, systematic way. Even if the course learning outcomes being studied are from a first-year course at a four-year college, leaving the student three further years in the institution, students drop out, select different subsequent elective courses, or even change major tracks.

That problem is what made the USAFA study particularly significant. Conducted from 1997 to 2007, the subjects were 12,568 USAFA students. The researchers were Scott E. Carrell, of the Department of Economics at the University of California, Davis and James E. West of the Department of Economics and Geosciences at USAFA.

As I noted earlier, since USAFA is a fairly unique higher education institute, extrapolation of the study’s results to any other educational environment requires knowledge of what kind of institution it is.

USAFA is a fully accredited undergraduate institution of higher education with an approximate enrollment of 4,200 students. It offers 32 majors, including humanities, social sciences, basic sciences, and engineering. The average SAT for the 2005 entering class was 1309 with an average high school GPA of 3:60 (Princeton Review 2007). Applicants are selected for admission on the basis of academic, athletic, and leadership potential, and a nomination from a legal nominating authority. All students receive 100 percent scholarship to cover their tuition, room, and board. Additionally, each student receives a monthly stipend of $845 to cover books, uniforms, computer, and other living expenses. All students are required to graduate within four years, after which they must serve a for five years as a commissioned officer in the Air Force.

Approximately 17% of the study sample was female, 5% was black, 7% Hispanic, and 5% Asian. 

Academic aptitude for entry to USAFA is measured through SAT verbal and SAT math scores and an academic composite that is a weighted average of an individual’s high school GPA, class rank, and the quality of the high school attended. All entering students take a mathematics placement exam upon matriculation, which tests algebra, trigonometry, and calculus. The sample mean SAT math and SAT verbal are 663 and 632, with respective standard deviations of 62 and 66. 

UAAFA students are required to take a core set of approximately 30 courses in mathematics, basic sciences, social sciences, humanities, and engineering. Grades are determined on an A, A-, B+, B, …, C-, D, F scale, where an A is worth 4 grade points, an A- is 3.7 grade points, a B+ is 3.3 grade points, etc. The average GPA for the study sample was 2.78. Over the ten-year period of the study there were 13,417 separate course-sections taught by 1, 462 different faculty members. Average class size was 18 students per class and approximately 49 sections of each core course were taught each year.

USAFA faculty, which are both military officers and civilian employees, have graduate degrees from a broad sample of high quality programs in their respective disciplines, similar to a comparable undergraduate liberal arts college. 

Clearly, in many respects, this reads like the academic profile many American four-year colleges and universities. The main difference is the nature of the student body, where USAFA students enter with a specific career path in mind (at least for nine years), albeit a career path admitting a great many variations, perhaps also, in many cases, with a high degree of motivation. While that difference clearly has to be taken in mind when using the study’s results to make inferences for higher education as a whole, the research benefits of such an organization are significant, leading to results highly reliable for that institution.

First, there is the sheer size of the study population. So large, that there was no problem randomly assigning students to professors over a wide variety of standardized core courses. That random assignment of students to professors, together with substantial data on both professors and students, enabled the researchers to examine how professor quality affects student achievement, free from the usual problems of student self-selection. 

Moreover, grades in USAFA core courses are a consistent measure of student achievement because faculty members teaching the same course use an identical syllabus and give the same exams during a common testing period. 

Student grades in mathematics courses, in particular, are particularly reliable measures. Math professors grade only a small proportion of their own students’ exams, which vastly reduces the ability of “easy” or “hard” grading professors to affecting their students’ grades. Math exams are jointly graded by all professors teaching the course during that semester in “grading parties” where Professor A grades question 1 for all students, Professor B grades question 2 for all students, and so on. Additionally, all professors are given copies of the exams for the course prior to the start of the semester. All final grades in all core courses are determined on a single grading scale and are approved by the department chair. Student grades can thus be taken to reflect the manner in which the course is taught by each professor.

A further significant research benefit of conducting the study at USAFA is that students are required to take, and are randomly assigned to, numerous follow-on courses in mathematics, humanities, basic sciences, and engineering, so that performance in subsequent courses can be used to measure effectiveness of earlier ones—which, as we noted earlier, is a far more meaningful measure of (real) learning than weekly assignments or an end-of-term exam.

It is worth noting also that, even if a student has a particularly bad introductory course instructor, they still are required to take the follow-on related curriculum.

If you are like me, given that background information, you will take seriously the research results obtained from this study. At a cost of focusing on a special subset of students, the statistical results of the study will be far more reliable and meaningful than for most educational studies. Moreover, the study will be measuring the important, long term benefits of the course. So what are those results?

First, the researchers found there are relatively large and statistically significant differences in student achievement across professors in the contemporaneous course being taught. A one-standard deviation increase in the professor fixed effect (a variable like age, sex, ethnicity, or qualifications, that is constant across individuals) results in a 0:08 to 0:21-standard deviation increase in student achievement. 

Introductory course professors significantly affect student achievement in follow-on related courses, but these effects are quite heterogeneous across subjects.

But here is the first surprising result. Students of professors who as a group perform well in the initial mathematics course perform significantly worse in the (mandatory) follow-on related math, science, and engineering courses. For math and science courses, academic rank, teaching experience, and terminal degree status of professors are negatively correlated with contemporaneous student achievement, but positively related to follow-on course achievement. That is, students of less experienced instructors who do not possess terminal degrees perform better in the contemporaneous course being taught, but perform worse in the follow-on related courses. 

Presumably, less academically qualified instructors may spur (potentially unsustained) interest in a particular subject through higher grades, but those students perform significantly worse in follow-on related courses that rely on the initial course for content.  (Interesting side note: for humanities courses, the researchers found almost no relationship between professor observable attributes and student achievement.)

Turning our attention from instructors to students, the study found that students who struggle and frequently get low grades tend to do better than the seemingly “good” students, when you see how much they remember, and how well they can perform, months or even years later

This is the result I discussed in the previous post. On the face of it, you might still find that result had to believe. But it’s hard to ignore the result of a randomized control study of over 12,000 students over a period of nine years.

For me, the big take-home message from the study is the huge disparity between course grades produced at the time and assessment of learning obtained much later. The only defense of contemporaneous course grades I can think of is that in most instances they are the only metric that is obtainable. It would be a tolerable defense were it not for one thing. Insofar as there is any correlation between contemporaneous grades and subsequent ability to remember and make productive use of what was learned in the course, that correlation is negative.

It makes me wonder why we continue, not only to use end-of-course grades, but to frequently put great emphasis on them and treat them as if they were predictive of future performance. Continuous individual assessment of a student by a well trained teacher is surely far more reliable.

A realization that school and university grades are poor predictors of future performance is why many large corporations that employ highly skilled individuals increasingly tend to ignore academic grades and conduct their own evaluations of applicants.

On making omelets and learning math

As the old saying goes, “You can’t make an omelet without breaking eggs.” Similarly, you can’t learn math without bruising your ego. Learning math is inescapably difficult, frustrating, and painful, requiring high tolerance of failure. Good teachers have long known this, but the message has never managed to get through to students and parents (and it appears, many system administrators who evaluate students, teachers, and schools).

The parallel (between making omelets and learning math) plays out in the classroom in a manner that many students and parents would find shocking, were they aware of it. It’s this.

All other factors being equal, when you test how well students have mastered course material some months or even years after the course has ended, students who do well in courses, getting mostly A’s on assignments and exams, tend to perform worse than students who struggled and got more mediocre grades at the time.

Yes, you read that correctly, the struggling students tend to do better than the seemingly “good” students, when you see how much they remember, and how well they can perform, months or even years later.

There is a caveat. But only one. This is an “all other things being equal” result, and assumes in particular that both groups of students want to succeed and make an effort to do so. I’ll give you the lowdown on this finding in just a moment. (And I will describe one particular, highly convincing, empirical demonstration in a follow-up post.) For now, let’s take a look at the consequences.

Since the purpose of education is to prepare students for the rest of their lives, those long term effects are far more important educationally than how well the student does in the course. I stressed that word “educationally” to emphasize that I am focusing on what a student learns. The grade a student gets from a course simply measures performance during the course itself. 

If the course grade correlated positively with (long-term) learning, it would be a valuable measure. But as I just noted, although there is a correlation, it is negative.  This means that educators and parents should embrace and celebrate struggle and mediocre results, and avoid the false reassurance of progress that is so often the consequence of a stellar classroom performance. 

Again, let me stress that the underlying science is an “all other things being equal” result. Assuming that requirement is met, a good instructor should pace the course so that each student is struggling throughout, constantly having to spend time correcting mistakes.

The simple explanation for this (perhaps) counter-intuitive state of affairs is that our brains learn as a result of trying to make sense of something we find puzzling, or struggling to correct an error we have made. 

Getting straight A’s in a course may make us feel good, but we are actually not learning something by so doing; we are performing. 

Since many of us discover that, given sufficient repetitive practice, we can do well on course assignments and ace the final exam regardless of how well we really understand what we are doing, a far more meaningful measure of how well we have learned something is to test us on it some time later. Moreover, that later test should not just be a variant of the course final exam; rather we should be tested on how able we are in making use of what we had studied, either in a subsequent course or in applying that knowledge or skills in some other domain.

It is when subjected to that kind of down-the-line assessment that the student who struggled tends to do better than the one who performed well during the course.

This is not just some theoretical idea, removed from reality. In particular, it has been demonstrated in a large, random control study conducted on over 12,000 students over a nine-year period.

The students were of traditional college age, at a four-year institution, and considerable effort was put in to ensuring that all important “all other things being equal” condition was met. I’ll tell you about the study and the institution where it was carried out in a follow-on post to this one. For now, let’s look at its implications for math teaching (for students of all ages).

To understand what is going on, we must look to other research on how people learn. This is a huge topic in its own right, with research contributions from several disciplines, including neurophysiology.

Incidentally, neurophysiologists do not find the negative-correlation result counter-intuitive. It’s what they would expect, based on what they have learned about how the brain works. 

To avoid this essay getting too long, I’ll provide an extremely brief summary of that research, oriented toward teaching. (I’ll come back to all these general learning issue in future posts. It’s not an area I have worked in, but I am familiar with the work of others who do.) 

Learning occurs when we get something wrong and have to correct it. This is analogous to the much better known fact that when we subject our bodies to physical strain, say by walking, jogging, or lifting weights, the muscles we strain become stronger—we gain greater fitness.

The neurophysiologists explain this by saying that understanding something or solving a problem we have been puzzling over, is a consequence of the brain forming new connections (synapses) between neurons. (Actually, it would be more accurate to say that understanding or solving actually is the creation of those new connections.) So we can think of learning as a process to stimulate the formation of new connections in our brain. (More accurately, we should think of learning as being the formation of those new connections.)

Exactly what leads to those new connections is not really known—indeed, some of us regard this entire neurons and synapses model of brain activity as, to some extent, a scientific metaphor. What is known is that it is far more likely to occur after a period in which the brain repeatedly tries to understand something or to solve the problem, and keeps failing. (This is analogous to the way muscles get stronger when we repeatedly subject them to strain, but in the case of muscles the mechanism is much better understood.) In other words, repeatedly trying and failing is an essential part of learning.

In contrast, repeatedly and consistently performing well strengthens existing neuronal connections, which means we get better at whatever it is we are doing, but that’s not learning. (It can, however, prepare the brain for further learning.) 

Based on these considerations, the most effective way to teach something in a way that will stick is to put students in a position of having to arrive at the best answer they can, without hints, even if it’s wrong. Then, after they have committed, you can correct, preferably with a hint (just one) to prompt them to rectify the error. Psychologists who have studied this refer to the approach as introducing “desirable difficulties.” Google it if you have not come across it before. The term itself is due to the Stanford psychologist Robert Bjork. 

For sure, the result of this approach makes students (and likely their parents and their instructor) feel uncomfortable, since the student does not appear to be making progress. In particular, if the instructor gauges it well, their assignment work and end-of-term test will be littered with errors. (Instructors should grade on the curve. I frequently set the pass mark around 30%, with a score of 60% or more correct getting an A, though in an ideal world I would have preferred to not be obliged to assign a letter grade, at least based purely on contemporaneous testing.)

Of course, the students are not going to be happy about this, and their frustration with themselves is likely to be offloaded onto the instructor. But, for all that it may seem counterintuitive, they will walk away from that course with far better, more lasting, and more usable learning than if they had spent the time in a feelgood semester of shallow reinforcement that they were getting it all right. 

To sum up: Getting things right, with the well-deserved feeling of accomplishment it brings, is a wonderful thing to experience, and should be acknowledged and rewarded—when you are out in the world applying your learning to do things.  But getting everything right is counterproductive if the goal is meaningful, lasting learning. 

Learning is what happens by correcting what you got wrong. Indeed, the learning is better if the correction occurs some time after the error is made. Stewing for a while in frustration at being wrong, and not seeing how to fix it, turns out to be a good thing. 

So, if you are a student, and your instructor refuses to put you out of your misery, at least be aware that the instructor most likely is doing so because they want you to learn. Remember, you can’t learn to ride a bike or skateboard without bruising your knees and your elbows. And you can’t learn math (and various other skills) without bruising your ego. 

Cracking your ego is an unavoidable part of learning.