In my April 9 post, I discussed the possible benefits and (more significantly) drawbacks and likely dangers of using Large Language Model (LLM) AI systems in mathematics. I promised I would post a follow-up article on how humans do mathematics. Or, more accurately, how we think we do it. (Not the general “we”, rather the cognitive scientists who study that kind of thing.)
Though many of us have been surprised at the performance of the more recent LLMs, humans designed them and we know how they work, down to the fine detail. In contrast, we have no real knowledge of how our minds work. We did not design them. In fact, it’s by no means certain our current state of scientific knowledge is capable of (ever) describing, let alone explaining, how our minds work. Indeed, there is a strong, natural selection argument to be made that we will never have conscious access to the “inner workings” of our mind. (See the MAA Devlin’s Angle essays for January and February 2023.)
The best we can do is list some features of how we think. Insofar as mathematical thought is just a highly restricted form of human thought (as language and music are restricted forms of human communication), these considerations provide a starting point for speculating how we do mathematics.
Our brains evolved to help us survive in our environment. We possess perception and action systems that intervene on the external world and generate new information about it. Those action systems utilize causal representations that are embodied in theories (scientific or intuitive) and are also the result of truth-seeking epistemic processes. We evaluate those theories with respect to an external world and make predictions about and shape actions in that world; new evidence from that world can radically revise them.
Causal representations, such as perceptual representations, are designed (by natural selection) to solve “the inverse problem”: we can reconstruct the structure of a novel, changing, external world from the data that we receive from that world.
Those representations may be very abstract, as in scientific theories, but they ultimately depend on perception and action—on being able to perceive the world and act on it in new ways.
As a result of cultural evolution, we can learn not only from our experience in the world, but also from one another. There is a balance between two different kinds of cognitive mechanisms. Innovation produces novel knowledge or skill through contact with a changing world. Imitation allows the transmission of knowledge or skill from one person to another.
Imitation means that each individual does not have to innovate—we can take advantage of the cognitive discoveries of others. But imitation by itself would be useless if some agents did not also have the capacity to innovate. It is the combination of the two that allows cultural and technological progress.
At virtually every stage, our cognitive apparatus and reasoning confront the world, either directly or through other agents we interact with.
Now contrast the above considerations with a LLM, which aggregates large amounts of information that have been generated by people and uses relatively simple statistical inference to extract patterns from that information. No contact with the world, no mediation by the world.
The design of an LLM certainly allows for the production of information we were nor previously aware of, and we may sometimes be surprised by the results we get. Nevertheless (in contrast to the human mind) we understand the mechanism of production, down to the fine detail. And it has none of the real-world guardrails of human cognitive activity.
Nothing in the training or objective functions of a LLM is designed to fulfill the epistemic functions of truth-seeking systems such as perception, causal inference, or theory formation.
That leaves them with the role of (potentially-) useful tools for our individual and societal use. That may turn out to be progress. This new tool may change the way we live and work; if so, then likely in ways that will surprise us (maybe even horrify us, at least initially). Or it may turn out to be for the most part a relatively short-lived, hype-driven bubble. My instinct says it’s the latter, but as a scientist I remain open to being convinced otherwise.
As with any tool that has “hidden parts”, however, it is critical that anyone who uses it understands how it works, what its limitations are, and what dangers those limitations can lead to. Bender’s wonderful term “stochastic parrots” to describe LLMs first appeared in a 2021 research paper titled On the Dangers of Stochastic Parrots: Can Language Models Be Too Big? Note that word “dangers” in her title. (The paper appeared before ChatGPT burst onto the scene.) I’m on record as describing LLMs tongue-in-cheek as “tech-bro mansplaining”.
Will Large Language Models (LLMs) such as ChatGPT change how mathematics is done? When earlier computing technologies came along, they resulted in major changes in how we do mathematics: mechanical and then electronic calculators, general purpose digital computers, graphing calculators, etc. and more recently tools such as Mathematica, Maple, and (my favorite) Wolfram Alpha.
The latter three above can all lay claim to being a special kind of “artificial intelligence”, though as with chess-playing systems, the highly restricted nature of the domain means we don’t generally classify them as such. But here’s the point. Those products already do all procedural mathematics, so there is (almost – read on) nothing left for new AI systems like ChatGPT to do that we don’t already have.
Certainly, if you take an LLM and connect it to a system like Wolfram Alpha, you get a powerful tool. As reported by Conrad Wolfram in March of last year, that combo scored 96% in a UK Maths A-level paper. That’s the exam taken at the end of school, as a crucial metric for university entrance.
What ChatGTP did was convert the questions on the test into the form where they could be solved by Wolfram Alpha. Given the correct input, Alpha will give the correct result every time. So credit for that 96% score should go to Alpha. The 4% error was presumably due to ChatGPT screwing up the interpretation of some questions.
But will LLMs on their own have a big impact? Here, things are far less clear cut; in fact, using an LLM to answer a math problem is probably best avoided. In that UK study I cited above, ChatGPT scored a mere 43% when given the A-level questions to answer on its own.
That poor performance is hardly surprising. LLMs are, as the name suggests, language processors. Basically, they look at what you enter and trawl through a massive database of Web-based text to see what the most likely next letter or groups of letters is, and iterate on that. There is, to be sure, more to it; for one thing they use traditional natural language processing algorithms and other AI techniques to decide what kind of response you are looking for. But the core technique is finding the best guess of what comes next and spitting that out. It’s tech-bro mansplaining writ large. The linguist Emily Bender has referred to them as “stochastic parrots”, a description I find particularly apt.
A completely nonsensical ChatGPT reply generated during a session where the user wanted to know what the 100th digit of pi is. The program has no problem giving two mutually contradictory statements and claiming they are “the two correct answers”. It has no concept of truth; indeed it has no understanding at all.
In particular, the LLM has no machinery to determine truth or factuality. That’s why LLMs so frequently “hallucinate”, that is, produce output text that reads smoothly but is totally false.
In contrast, mathematics is a discipline that is all about truth: mathematical truth (based on axioms) in the case of pure mathematics, and factual truth when we apply mathematics to the world.
For all its abstraction, however, mathematics is firmly rooted in the physical and social world. Its fundamental concepts are not arbitrary inventions; they are, indeed, abstractions from the world.
That process of abstraction goes back to the very beginnings of mathematics, with the emergence of numbers around 10,000 years ago in Sumeria. I recounted that history in an online presentation for the New York based Museum of Mathematics on June 28 last year. You have to pay MoMath to view it (or the entire four-part series it was part of), but supporting the museum is a worthy cause!
Historically, numbers are the most basic mathematical abstractions. Though the numbers we use today, including the counting numbers — often introduced to children as points on a number line — are a late 19th early 20th Century creation, for most of history, counting numbers were multitude-species pairs having their origin in monetary systems (as with our “4 dollars and 90 cents” currency numbers). The transition from those early numbers into today’s pure abstractions took many centuries. (Negative numbers were not accepted as bona fide mathematical objects until the 19th Century.)
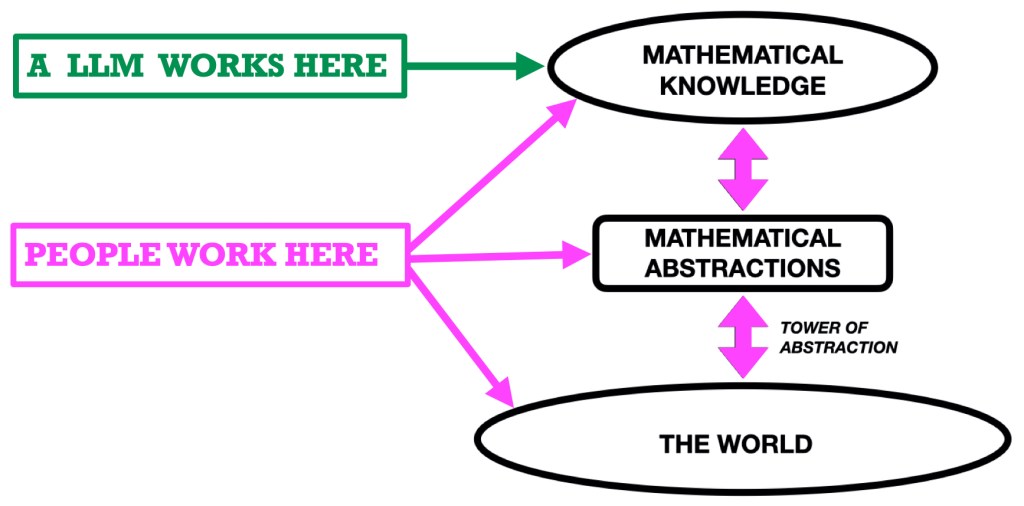
The towers of abstraction. Mathematical abstractions start in the world and then build on each other.
The many abstract entities of modern (advanced) mathematics, such as groups, rings, fields, Hilbert spaces, Banach spaces, and so on, are all connected to the real world by towers of abstractions. For all its seemingly esoteric nature, mathematics is firmly rooted in the real world. That’s why mathematical results can be applied to the real world; for example, theorems about geometric structures of dimension 4 and greater can be (and are) applied to solve real-world problems about communications networks, transportation networks, and efficient data storage.
Though we mathematicians are comfortable working within that world of abstractions, we achieve that comfort by first (as students) ascending the towers, which means the meanings we ascribe to the concepts are grounded in reality — even if we are not consciously aware of that grounding. (Mathematicians, perhaps more so than many other people, are very aware of how little we understand what is going on in our minds, even when deeply engaged in problem-solving thought. That recognition is forced on us every time we get a breakthrough idea “out of nowhere”!)
Mathematics is, then, a semantic enterprise engaged in by creatures/minds that are deeply and fundamentally connected to reality, and which have motivations, desires, curiosity, and a drive to understand both the world and one another. In terms of the figure, we operate in the entire space shown in that landscape. Mathematical knowledge results from activity we engage in as such creatures using the concepts and methods that we and our predecessors have abstracted from the world.
Mathematicians work with abstractions they understand, and in doing so realize what they are doing and have an awareness of how those abstractions relate to one another and to the world. The thick, vertical purple arrows indicate that tacit knowledge. By contrast, an LLM works purely with letters of the alphabet.
LLMs, in contrast, operate exclusively in the upper region, MATHEMATICAL KNOWLEDGE. They process text. Not meanings, text (i.e., strings of symbols). Whereas we humans can make advances by seeing patterns in the semantic entities we are studying, LLMs (implicitly) discern patterns in the symbols they process. Those patterns reflect the popularity of the symbols in a vast corpus of text produced by humans (and, increasingly, their own earlier productions and those of other LLMs, which may turn out to be a major problem for them and us).
[In a follow-up post, I’ll summarize current thinking in cognitive science about how we think — about mathematics, or anything else for that matter — to highlight just how different our thinking is from how LLMs work.]
For the most part, the productions of LLMs are correct because most of the texts they draw upon are correct — especially if the LLM is restricted to draw on sources that have passed through some form of review and editorial control. (Is this the case?) But as is already now well known, they can produce outputs that seem sensible but on examination are total nonsense.
This, I think, is a major weakness in LLMs as “thinking machines”. Even when our head is in the mathematical clouds, we humans have our feet firmly on the ground. (Metaphorically; many of us curl up on a comfy chair to ruminate.) We are living creatures of the world and we are an interactive part of the world, with brains that evolved to act in, react to, and think about the world. We think in meanings. An LLM inputs and outputs strings of symbols. Period. Those are vastly different kinds of activity.
The fact that we can give meaning to LLMs’ outputs reflects our cognitive abilities, not theirs; they are just doing what we built them to do. (Much like the clocks we build; a clock does not have a concept of time; we construct clocks so that we can interpret their state as the time.) Using words like “intelligence” or “thinking” for AI systems is a category error. LLMs do something different from us. (Think of them as a very fancy analogue of a clock, designed to report on the current state of the human knowledge stored on the Internet.) We should view them as such.
If you use an LLM to work on a math problem where the answer you get has any significance for you or anyone else (e.g. you are an engineer working on the design of a bridge), you need to be sure you have the ability to detect that the answer is wrong.
That critical caveat aside, I am intrigued by the possibility that a LLM will detect a pattern in the vast corpus of mathematical knowledge on the Web that we humans are unlikely to discern. It’s not impossible (though perhaps highly unlikely) that an LLM could produce an original result this way, giving the world its first “LLM’s Theorem”.
More likely, I think, we mathematicians could use an LLM to make us aware of (human or written) sources we did not know about. (LLMs as “dating apps for mathematicians trying to prove theorems” anyone?) We can of course do that already using a search engine; indeed, many of us use Google as a first port-of-call when starting on a new problem, for precisely that reason. But the LLM brings something new: the capacity to discern syntactic (i.e., symbolic) patterns in the vast corpus of written mathematics that humans are (for reasons of scale, if nothing else) not capable of discerning. Many of those patterns may turn out to have no mathematical import. But some may. That’s something we have never had before.
But this possible use of LLMs is available only to experienced mathematicians. For everyone else, I’ll repeat my above caution: avoid their use in mathematics unless you are sure you can detect a wrong answer. Because there is a real possibility you will get a doozy.
NOTE: This post is a much shorter version of an essay I published in the MAA blog Devlin’s Angle in March.
I received the email reproduced below a few days ago. (I have made a couple of minor presentation edits for publication here.) I get a lot of emails from laypersons and journalists every time one of those social media viral exchanges comes along. This particular one began by referencing a video of a television interview I had done on that title question back in 2019 when I was a visiting professor in my native UK; here it is.
This email was interesting because it highlighted something I long ago realized: that many people — among them some school mathematics teachers — have a perception of algebra that mathematicians abandoned in the seventeenth century. I’ll come to that presently. First, here is that email.
The (first) email
START
Re: The viral maths equation ‘8 ÷ 2(2 + 2)’
Hello Dr. Devlin,
I saw you featured in a YouTube video on the subject of the viral maths equation ‘8 ÷ 2(2 + 2),’ and I have a few thoughts about it.
Every few years, it seems, someone writes another of this type of mathematical statement, claiming that the definitive answer is such-and-such — even though there is some dispute as to how to solve the statement. There really is nothing confusing or ambiguous in the way these statements are being written. Here’s why.
A few years back, there was this statement: 6÷2(1+2).
Let me pose a word problem to illustrate how this is properly solved:
Let’s say you have a half-dozen cupcakes. Sitting at each of the 2 tables in the room is 1 girl and 2 boys. You’re giving the cupcakes to the children. How many cupcakes does each child get?
6÷2(1+2)
2(1+2) is a term, specifically a monomial — like 2x. A monomial has a single value of the PRODUCT of the coefficient multiplied by the variable (factor). Since a monomial has a singular value (indicated by juxtaposition), no additional brackets are ever necessary around a monomial.
Now let’s say that the cupcakes came in 2 packages, with each pack containing 1 vanilla cupcake and 2 chocolate cupcakes. The statement of “cupcakes divided by children” can now be written as:
2(1+2)÷2(1+2)
or with a slash…
2(1+2)/2(1+2)
Now replace what’s inside the parentheses [1+2] with the variable “x,” making the statement: 2x/2x
Obviously, the quotient is not “x squared,” because you’re dividing one monomial by another monomial — which, as you know, is a FRACTION (whether written vertically as something-over-something, or written horizontally on a single line using a slash or obelus). With monomials, you don’t get to peel off the coefficient & do some other operation with it as if it had no bearing on the variable. Again, there is never a need for additional brackets around a monomial because of its inherent singular value (indicated by juxtaposition).
This is correct, isn’t it?
END
The email exchange
I won’t reproduce my reply and the brief exchange that followed. Let me just say that after two exchanges I suspected my correspondent was not interested in learning anything, rather they wanted to explain to me why I was wrong, both in my video interview and in my initial reply. I get a lot of emails like that. In any event, the heart of my initial reply was this.
Yes, if we regard that symbolic expression “8 ÷ 2(2 + 2)” as simply a formal representation of the cupcake scenario then what my correspondent wrote was correct. But that is to impose a semantics on the expression, whereas a big part of algebra, as it developed from the sixteenth century to the late nineteenth century, was to provide an axiomatically-defined, precise “language of mathematics” (and by extension “language of science”), built on an abstract ontology, that can be used in many domains — a “mathesis universalis”, to use a classical term. And in that framework, that expression was not well-formed, and as a result was ambiguous. [Only later in the exchange did I point out that the puzzler they quoted is not an equation, it’s a formal expression (that can be part of an equation).]
I sent my initial reply and then kept the exchange going beyond that because I suspected my correspondent was a math teacher, and wanted to help them bring their thinking up-to-date for the sake of their students. But when their second email did little more than rephrase the same argument, this time using scholastic-Latin words such as vinculum, solidus, and obelus, I feared the worse: a dogmatic math teacher trapped in ancient Greece. Oh dear. But after a couple of further emails from them I realized they really were trying to understand what the issue was. Email is a crude form of communication, particularly with someone you know nothing about. I was glad I had (as is my practice) not let my suspicions get in the way of trying to answer questions as helpfully as I can. It did appear though, that my correspondent did not have sufficient background in modern mathematics to appreciate the points I was trying to make. In that, they are by no means alone. Read on.
By the time I sent my final reply, I’d got enough written down in my three reply emails to turn it into a short essay on the (significant) issues that lie behind those Internet “debates”. The fact that they keep arising shows the degree to which society as a whole has yet to take on board the significant revolution that took place over the past five-hundred years, not just in the nature of mathematics in general, and not just in algebra, but in the very concept of numbers.
What is algebra and how did it begin?
Much of the powerful elegance of algebra as understood today is that its grammar and calculational rules apply whatever the letters or symbols in its expressions are taken to refer to. That power is particularly important in calculus, which helps explain why calculus inventor Isaac Newton played a role in the creation of the number concept required for today’s algebra. (Until then, numbers were quantity-species pairs, much like our present-day currency, with “numbers” such as $5:45c.) Any college calculus instructor will tell you that when a student says they find calculus hard, the problem invariably lies with an inadequate understanding of algebra.
[ASIDE: So great is the difference between algebra that was practiced for many centuries prior to the time of Newton, and the subject as understood today, that some historians of mathematicians refer to the former as “pre-modern algebra” to avoid confusion.]
It is because algebra as understood today has so many applications, that when a mathematician is asked
“Does 1 + 1 = 2?”
they will likely reply “It depends.”
When the expression “1 + 1″ is interpreted in terms of everyday arithmetic, it is indeed true. But equally, “1 + 1 = 10” can be true, being an identity that lies at the heart of every digital device in today’s world. So it really does “depend”.
Pretty well all of those Internet debates about algebraic expressions boil down to applying a grammatically-incorrect expression in today’s algebra, crafted to be inherently ambiguous. The various classroom rules for parsing algebraic expressions, going by mnemonics such as PEMDAS, BODMAS, FOIL, etc.) all try to force algebra back to into the rigid box of pre-modern algebra, from which it emerged over 350 years ago. But when you do that, you are no longer doing algebra, you are doing arithmetic. Which is fine; it’s just not algebra. And with our arithmetic being done for us today by machines, we educators should focus on the powerful mental framework called algebra, that we have developed to understand, and to act in, the world.
It is however, easy to understand how the confusion arose. Algebra began as an arithmetic tool, developed and used by artisans to solve real-world arithmetic problems, as far as we can tell sometime in the last millennium before the Current Era, somewhere between Europe and India.
Images of al-Khwārizmī you can find on the Web are all artists’ creations. But this cover page from a copy of his book Algebra is for real.
Major advances were made in ancient Greece and First-Millennium India. (Clear antecedents to algebra have been found in Mesopotamian clay tablets dating back some 4,000 years.) By the ninth century algebra had been used by merchants and others in Baghdad, and a local scholar, al-Khwārizmī, helped turn it into an academic discipline by writing a practical algebra textbook. (He tells us in the introduction that his purpose in writing the book was not scholarship, but to help future artisans learn the method.)
[It is sometimes erroneously claimed that al-Khwārizmī was the first person to invent algebra. That’s clearly not the case. For one thing, several hundred years earlier, Diophantus of Alexandria had written an algebra book (Arithmetica); for another, al-Khwārizmī explains in his preface that he was simply collecting together in a book what was common knowledge at the time. What is the case is that his book, in addition to presenting a systematic theory of polynomial equations up to degree two, was the first in the chain of scholastic texts that led to today’s algebra — a chain that, not long after al-Khwārizmī’s death, incorporated the algebra of Diophantus, when his Arithmetica was translated into Arabic.]
The heart of the method of algebra (more precisely, premodern algebra) was that, when you want to find a number that solves a particular arithmetical problem, you perform four steps:
1. Start by giving the unknown number a name (in today’s school algebra, typically the letter x).
2. Formulate an equation that involves the named unknown.
3. Simplify that equation (if possible).
4. Solve the simplified equation to determine the value of the unknown.
Step 1 is trivial, and Step 2 is translation from one language into another. No calculations there. It’s in Step 3 that you might find yourself doing symbol manipulations that today we call “doing algebra”. Simplification of the equation was required in large part because they did not have negative numbers, and at best a sort of pseudo-subtraction. The goal of Step 3 was to put the equation into a form for which Step 4 is purely numerical calculation.
Step 3 was then, the key, and usually the hardest. And it is from Step 3 that the (entire) method got its name, algebra. The Arabic terms for the two main rules for simplifying an equation were al-jabr (“restoration”), which amounted to the transposition of subtracted terms to the other side of the equation, and al-muqābala (the word means “confrontation”, in the sense of being put face-to-face to achieve a result, much like a game of chess), which amounted to the cancellation of like terms on opposite sides of the equation. The entire phrase al-jabr wal-muqābala was used to refer to the overall technique.
Al-Khwārizmī used that Arabic phrase in the title of his book, and our modern word “algebra” derives from the first word of the phrase.
How did we get from al-Khwārizmī’s algebra to today’s “language of science”?
Following al-Khwārizmī, a succession of developments in the Islamic mathematical world steadily increased the power of algebra, and in the early thirteenth century, aided by scholars such as Leonardo Fibonacci in Italy, the method crossed the Mediterranean into Europe.
Despite the input of scholars, it remained, however, primarily a practical tool used by merchants, civil engineers, and (in a more restricted way) lawyers handling inheritance matters. But that started to change in the sixteenth century.
The algebra revolution — for so it would become — that began in the sixteenth century was set in motion by the work of the Frenchman François Viète, who developed a variant of pre-modern algebra to operate not on numbers but geometric magnitudes (lines, rectangles, cubes, etc.). An important side-effect of that work was that it marked the first time letters were used to denote both unknown and known quantities. (Viète had no other choice. How else do you refer to geometric magnitudes, whether known or unknown?)
In the following century, mathematicians such as René Descartes and Pierre de Fermat in France, Thomas Harriot in England, and others built on Viète’s work, producing what we can today recognize as a system that has many of the elements of present-day algebra. (As noted above, Newton was one of several mathematicians who revised the concept of number to better reflect the way the “new algebraists” were using them.) This was when algebra finally started to unmoor itself from arithmetic.
Finally, in the late 19th Century, today’s abstract algebra emerged, as an axiomatically defined “universal language” for mathematics that could be applied to many different domains, not just numbers.
Today’s algebra is a dazzling human invention, a pinnacle of human thought that took many centuries — and the contributions of peoples spread across the globe — to develop. “Algebra” went from being a special tool of arithmetic (in the form of premodern algebra) to a rich framework (today’s abstract algebra) within which arithmetic can be viewed as just one special case. The child became the parent — a parent that has many other offspring in addition to arithmetic.
Yet I fear that not all school teachers convey just what a powerful tool it is — in part I suspect because they are constrained by a curriculum centuries out of date. Indeed much of current K-12 “algebra instruction” seems to go no further than the pre-modern algebra used prior to the 17th Century.
No surprise then, that the population at large views “algebra” as something different from the discipline that is taught universally in colleges and universities. Those Internet debates result from that division.
This article is based on the law in California, where I live. You may have to adjust the numbers for other states.
Once you are on the freeway with a long drive ahead of you, it’s hard to resist the temptation to go a little bit faster (or maybe a lot faster) to shorten the time it takes to arrive. But is it worth the risk of getting a speeding ticket? A little math can help.
First of all, what is the financial risk of putting your foot down? (Speeding is not a criminal offense.) In California, the penalties are $237 for violations of 15 or more mph over the limit, $367 for violations of 25 or more mph over the limit, and $467 or more for violations of 26 or more mph over the limit.
You can also expect to get points on your license, but there is often the option of attending an (online) traffic school instead; you have to pay for that school, typically a fee of around $15 for a one-hour course you have to pass. (I haven’t had to do this in over a decade, so I looked up the details; they don’t seem to have changed much.) For most people, that’s not a major financial hit, but it is a pain to take the course; on the other hand, it avoids a usually otherwise unavoidable increase in your auto insurance.
Things get much worse if you exceed 100mph, when the offense jumps into another category: additional points on your record, a mandatory court date, and a suspension of your license (up to 30 days for a first offense).
So that gives some picture of what your attempt to shorten your journey time might cost you. But my interest here is whether it makes sense to take that risk. Just how much time can you save? The answer is, not much. The major time savings occur at speeds up to 70mph. Read on to see why.
For definiteness, let’s look at a journey of just 20 miles.
On a bicycle (permitted on bicycle lanes on some stretches of some California freeways), cycling the 20-mile journey at 10mph will take 120mins (2 hours).
If you cycle at 20mph it takes 60mins (1 hour). As a regular cyclist, I can still do that on a flat road; with an e-bike, anyone can. That’s not coming anywhere near the speed limit, but the time saving is massive: you halve the journey time!
Turning to car driving, the time in minutes it takes to travel 20 miles at different speeds are
30mph: 40mins
40mph: 30mins
30mph: 40mins
40mph: 30mins
50mph: 24mins
60mph: 20mins
70mph: 17.14mins (17min 8secs)
80mph: 15mins
90mph: 13.33mins (13min 20secs)
100mph: 12mins.
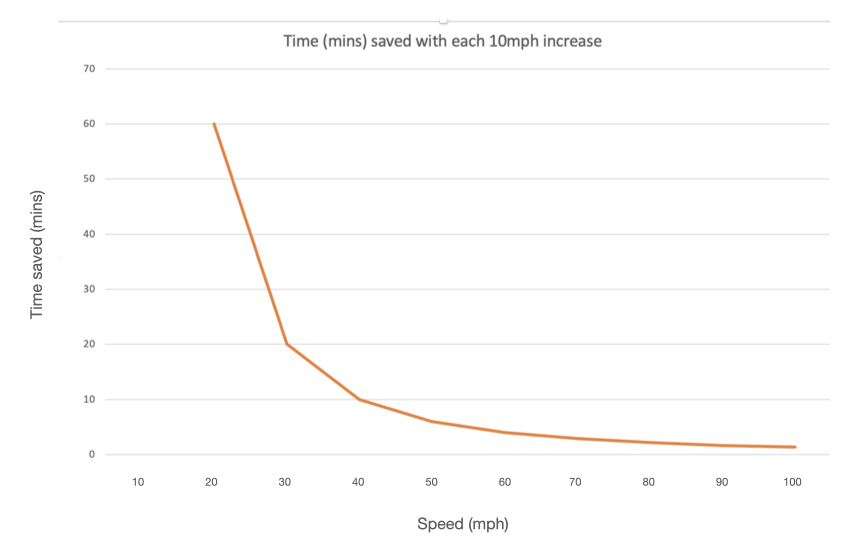
So, if you drive on the freeway at 100mph, you save just over 5 minutes compared to driving at the typical limit of 70mph.
As you can see when we graph these figures, the gain in time gets progressively less as the speed increases, with the big savings coming up to 40mph and becoming essentially irrelevant above 70mph.
I drive California freeways a lot, and I can tell you that many cars pass me at considerably more than 80mph or more, and they are way more likely to get stopped by the CHP than I do driving with my adaptive-cruise-control set to 75mph. (This happened to me just yesterday, when the Tesla that shot past me was pulled over soon afterwards, which is what prompted this essay.)
My guess is the driver was doing 100mph. Was it worth it? Driving at 100mph would save that individual just 5 minutes (on a 20 miles journey) over keeping strictly to the 70mph limit, and a mere 3 minutes over driving it at 80mph, where the consequences of being pulled over are way less severe.
To be sure, if you scale up by a factor of 5 to a trip of 100 miles, you are looking at savings of 25 minutes and 15 minutes, respectively. But if you are at all like me, after driving a hundred miles at a very high speed on a freeway, I really would not be able make productive use of that additional few minutes gained at the end; I just want to chill out. Moreover, it’s unlikely you would be able to maintain such a high speed for the whole journey; you’d be able to go above the speed limit just for stretches, and even if you managed to do so for a fifth of the trip your overall saving would be down to the 5 or 3 minutes computed above. The fact is, it simply makes no mathematical sense to take the risk.
I received the following email from a parent recently. (I have deleted some of the email to focus on the main issue, and have lightly edited the part included here.)
* * * * * * * *
Dear Professor Devlin,
I am the father of a 9 years old boy. Recently, I stumbled upon a few questions set by his school and I noticed that the answer provided by my son is wrong. I was really puzzled by it, and I looked for more information pertaining to the topic of Multiplication, Multiplier and Multiplicand. I found an article written by you in Devlin’s Angle, dated January 2011
which talks about multiplication. Having read that, I wish to seek your opinion on how you would perceive the answer to the question that was posted to my son and if it is wrong in any way?
It is a worded question:
A box of pencils consists of 12 pieces of pencils in them. The stationary shop decided to buy 165 boxes of pencils. Each pencil is set at $5 each for sale. The shop sold all the pencils. How much money did the stationary shop receive at the end of selling them all?
The answer:
The amount of money to receive at the end of selling all the pencils is:
165 x 12 x 5
= $9,900
The teacher mark my son wrong for the second line, as it should be
5 x 165 x 12
My point is that the first elementary rule in multiplication state that a x b = b x a, as in 3 x 2 = 2 x 3
Regardless of the placement of integer or whole number, there is no way you could deduct marks and mark it wrong, since no unit was written in the second line of answer unless you have written
165 boxes x 12pencils/box x $5
Since no unit was written, how could this answer be wrong, regardless if it is a worded question, as it might break the elementary rule of multiplication? If the elementary rule is to be broken, could the discussion of multiplier and multiplicand stand in this circumstance?
* * * * * * * *
The part of the email I have left out led me to suspect that the father was fairly knowledgeable about (at least) basic mathematics, and could even be, say, an engineer who makes regular use of mathematics but is (aware that he is) not an expert in elementary mathematics education.
As I was writing my reply, it occurred to me there is sufficient value in this brief exchange to warrant a post in this blog, which due to a variety of circumstances has lain idle for some months. And by “value” I mean value to all parties here, the student, the teacher, the parent, and perhaps also the person or entity that created the assessment, if other than the teacher. Here is what I wrote.
* * * * * * * *
Dear XXX,
Hmm. I don’t see any problem with writing the three numbers in a particular order. In fact, given how the question is phrased, I myself would express the calculation as 165 x 12 x 5. But, whatever the order, the student providing the answer clearly understands what is required, and their final answer is numerically correct. To mark an answer as wrong because of the order is idiotic, and really has nothing to do with mathematics.
There is a reason to mark the answer as written as incorrect, because the second line is nonsense. You can’t simply write
165 x 12 x 5
= $9,900
That’s improper use of the equal sign. If I were grading that test, I would note down for the student that the answer is numerically correct but add that what is written is mathematically wrong (in fact, as I just noted, it’s nonsense, but that’s not a good term to use with a student learning the subject), since it says that an integer is equal to a monetary amount. For instance, it would be okay write
165 x 12 x 5 = 9,900
Hence the answer is $9,900.
There are important issues involving the roles of the different values in multiplication, as you allude to in mentioning units. It’s possible the teacher was focusing on those, but simply marking an answer as wrong does not help the student learn to understand those roles. The order in which the numbers are written is not a mathematical issue, though some mathematical cultures probably have preferred conventions. (That’s all they are, however: conventions.) In contrast, knowing the different roles they play is a mathematical issue, and an important one.
So, I am in agreement with you regarding your comments on this particular question and answer. The problem I see is that a question designed to help students learn about multiplication to the extent of including units (i.e., not just a test of basic computational skills), as this one presumably was, cannot be effectively presented as a CORRECT/INCORRECT question. In particular, in this instance, the order in which the three values are written is not important, but knowing and understanding their roles is.
I think both student and teacher mis-stepped here. (In possible defense of the teacher, it may be that they were constrained by a systemic assessment framework that provided insufficient freedom to give this issue the degree of attention it required.) Analysis of the episode does, however, provide an excellent learning experience for all parties. And good learning is what education should be about.
I hope this helps. I will probably write a short post about this for my SUMOP blog (absent mention of any names or location), since I think it raises issues worth circulating. Thanks for writing. Best wishes to you and your son, KD.
* * * * * * * *
That was the exchange. Multiplication is a far more complex issue than is popularly assumed, even when restricted to the natural numbers. Indeed, it is the topic I have returned to more than any other in my monthly Devlin’s Angle blog for the Mathematical Association of America. As you will discover if you follow that thread (below), I stumbled onto the topic by accident, when a throwaway remark I made at the end of my September 2007 post turned out to open a hornet’s nest of misunderstandings.